Example 02 - Introduction to Trajectory Data#
This example will introduce:
Load the map matched trajectory data with
mtldp.utils.data_ioBasic classes for the trajectory data
After the trajectory data is matched on the map, you can load the trajectory by the data platform (mtldp) package.
1 Load trajectory data#
1.1 Load trajectory and matched points from CSV file#
[1]:
from mtldp.utils import show_attributes_and_methods
from mtldp.utils.data_io import build_trajectory_dict_from_csv
import time

s = time.time()
trajs_dict = build_trajectory_dict_from_csv(trajectories_filename='data/2021-09-27_trajs.csv',points_filename='data/2021-09-27_points.csv')
time.time() - s
[1]:
35.63425016403198
[2]:
for traj in trajs_dict:
    break
[3]:
len(traj.df)
[3]:
10
[4]:
show_attributes_and_methods(trajs_dict)
attributes: {'dict'}

methods: {'get_points_df', 'append', 'del_trajectory', 'get_trajs_df', 'groupby', 'add_trajectory'}
[5]:
show_attributes_and_methods(traj)
attributes: {'link_id', 'intervals', 'valid', 'stop_nums', 'spill_over', 'trip_id', 'date', 'stop_delay', 'queue_ratio', 'movement_id', 'control_delay', 'traj_id', 'arrival_time', 'service_level', 'veh_length', 'veh_width', 'cycle_failure', 'eta', 'tod', 'stop_details', 'df', 'junction_id', 'text', 'traj_attributes', 'free_v', 'timestamp', 'queue_dis', 'phase_id', 'date_time', 'total_time', 'pts_num', 'avg_speed', 'total_distance'}

methods: {'check_point_attribute', 'get_traj_df', 'get_point_attributes', 'get_points_df', 'get_time_range', 'add_traj_attributes', 'set_point_attributes', 'drop_duplicates', 'update_trajs_attributes_from_df'}
2 Trajectory data structure#
There are two data structures to store the trajectory data TrajectoryDict, and Trajectory.
2.1 TrajectoryDict#
TrajectoryDict is new class that mainly contains a dictionary of all the Trajectory objects in the .dict member. The key of .dict is trip_id, the value is Trajectory object.
[6]:
len(trajs_dict.dict)
[6]:
637779
2.3 Trajectory#
Trajectory contains all attributes of a trajectory. You can fetch a trajectory from a TrajectoryDict object.
[7]:
traj = trajs_dict.dict["006eb1ddec08e2ffac0a01c7f11c487316a8a44f-1632745748"]

traj.df[0:3]
[7]:
| trip_id | traj_id | junction_id | link_id | segment_id | movement_id | phase_id | timestamp | date | date_time | tod | latitude | longitude | distance | arrival_time | speed | error | heading | elevation | |
|---|---|---|---|---|---|---|---|---|---|---|---|---|---|---|---|---|---|---|---|
| 3610 | 006eb1ddec08e2ffac0a01c7f11c487316a8a44f | 006eb1ddec08e2ffac0a01c7f11c487316a8a44f-16327... | 62127887 | 62058105_62127887 | 7558579851 | 62058105_62127887_61977976 | 2 | 1.632746e+09 | 2021-09-27 | 08:28 | 8.472778 | 42.547322 | -83.192781 | -221.689549 | 1.632746e+09 | 17.597236 | 1.138452 | 182.0 | 194.0 |
| 3611 | 006eb1ddec08e2ffac0a01c7f11c487316a8a44f | 006eb1ddec08e2ffac0a01c7f11c487316a8a44f-16327... | 62127887 | 62058105_62127887 | 7558579851 | 62058105_62127887_61977976 | 2 | 1.632746e+09 | 2021-09-27 | 08:28 | 8.473611 | 42.547311 | -83.193415 | -169.723550 | 1.632746e+09 | 16.319458 | 2.554720 | 182.0 | 195.0 |
| 3612 | 006eb1ddec08e2ffac0a01c7f11c487316a8a44f | 006eb1ddec08e2ffac0a01c7f11c487316a8a44f-16327... | 62127887 | 62058105_62127887 | 7558579851 | 62058105_62127887_61977976 | 2 | 1.632746e+09 | 2021-09-27 | 08:28 | 8.474722 | 42.547302 | -83.193949 | -125.954757 | 1.632746e+09 | 13.438900 | 4.274432 | 182.0 | 194.0 |
[8]:
from mtldp.utils.time import timestamp_to_date_time_and_tod
[9]:
timestamp_to_date_time_and_tod(1632745746.6686296)
[9]:
('2021-09-27', '12:29', 12.483333333333333)
[10]:
times, lats, lons, errors = traj.get_point_attributes("timestamp", "latitude", "longitude", "error")

times[:3], lats[:3]
[10]:
([1632745702.624, 1632745705.621, 1632745709.119],
 [42.547322, 42.547311, 42.547302])
[11]:
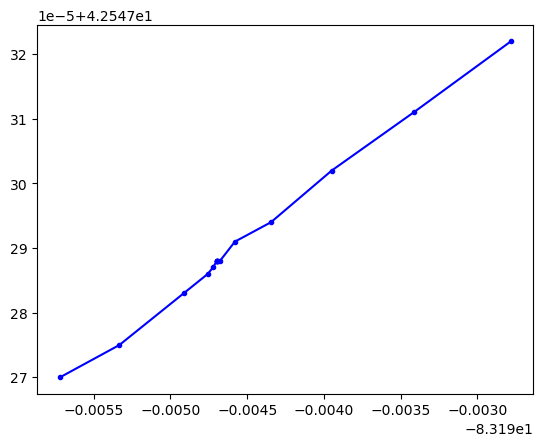
# Plot the shape of the trajectory

import matplotlib.pyplot as plt

plt.plot(lons, lats, "b.-")
plt.show()

You can plot the time-space diagram of a trajectory at a movement.
[ ]: